Discover diversity - higher education staff intersectionality

An interactive dashboard suite co-designed with HR professionals to help universities profile the diversity demographics of their staff.
About discover diversity
Co-designed with HR professionals from within the higher education (HE) sector, this interactive dashboard suite enables you to view and benchmark key staff diversity demographics, so you can develop and support your equality, diversity and inclusion (EDI) initiatives, as well as planning and monitoring. See how your staff characteristics combine or overlap to begin shaping your strategic vision for the future.
Discover diversity helps you to baseline, develop and monitor your EDI strategies, and measure progress with your implementation plans. It can also help you to compile critical evidence for EDI accreditation awards and showcase the important work you are doing. The dashboard suite also allows you to:
- Understand your staff profile in terms of sex, disability, ethnicity and age
- Identify your organisation’s intersectionality strengths and opportunities
- Identify trends
- Benchmark against custom groups of universities
- Generate forecasts against targets
- Measure staff FTE, pay gap and turnover
- Filter by university, academic contract, mode of employment, contract level, cost centre, and salary range
Interactive insights dashboard suites are available to OfS-registered higher education providers and are delivered via our Heidi Plus tool.
Key benefits
- Designed and built by expert HESA data users and Tableau developers to save you and your colleagues time and resources
- Includes dashboards that have been fully co-designed with HR professionals in your sector to help you address the big diversity challenges facing you and your provider
- Provides key dashboard insights through visual charts for easy comparisons and year-on-year analysis
- Benchmark your organisation’s performance sector wide
- Set your own adjustable targets and timescales within the product for full flexibility
- Uses five years of robust, quality-assured HESA staff data and built using a trusted, sector-led design process
- You are fully supported by the customer success team from day one
List of dashboards
Discover diversity includes a navigation portal and the following eight dashboards packed full of features and staff demographic insight, including:
- Intersectionality heatmap
- Population vs benchmark group
- Staff demographic trends
- Staff demographic (single year)
- Population vs benchmark dashboards (with bespoke targets set by the user for full flexibility):
- FTE (full-time equivalent) forecast against target
- FTE % forecast against target
- Turnover forecast against target
- Pay gap forecast against target
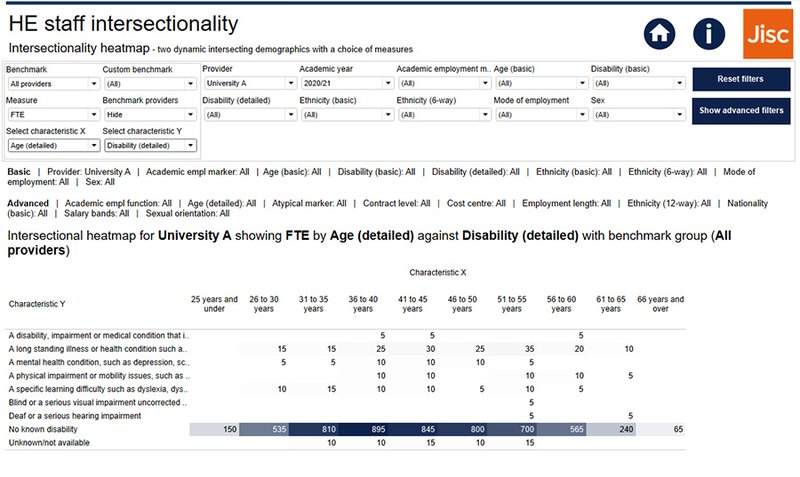
Example dashboard: Intersectionality heatmap
The below dashboard shows the staff intersectionality heatmap from the product for an example university. This cross-references two characteristics of the user’s choice, with the option to restrict the data being analysed using filters.
Please note: this example uses synthetic and anonymised data.
The below dashboard shows the staff intersectionality heatmap from the product for an example university. This cross-references two characteristics of the user’s choice, with the option to restrict the data being analysed using filters.
Please note: this example uses synthetic and anonymised data.
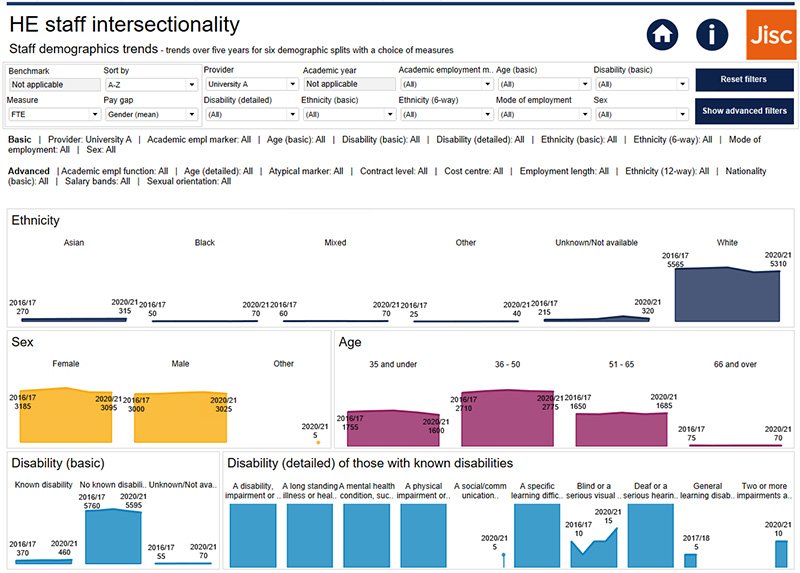
Example dashboard: Staff demographic trends dashboard
The below dashboard shows the staff demographic trends dashboard for an example university. This allows the user to explore trends in staff intersectionality during the latest five years, with the option to restrict the data being analysed using filters.
Please note: this example uses synthetic and anonymised data.
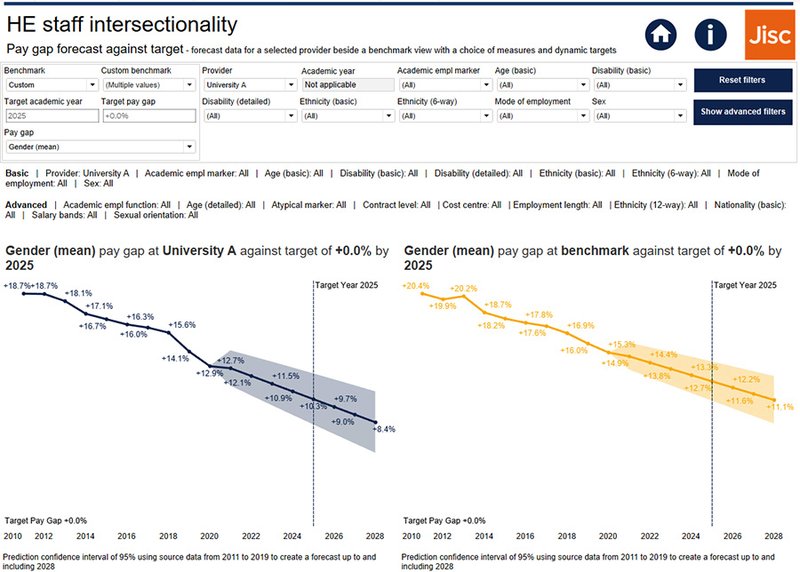
Example dashboard: Pay gap against forecast
The below dashboard shows the pay gap against forecast dashboard for an example university. This provides a forecast, based on recent trends, of the pay gap for each staff characteristic, and shows how the trajectory relates to the user’s bespoke, adjustable target.
This will help your organisation to understand whether further initiatives are required to achieve your target within your planned timescale - allowing you to be strategically proactive.
Please note: this example uses synthetic and anonymised data.
Who is it for?
The discover diversity interactive dashboard suite is for the following higher education professionals:
- HR professionals
- Equality, diversity and inclusion (EDI) leads
- Department heads
- Strategic planners
Accessing the dashboard
Once subscribed, the dashboard suite will be delivered via your Heidi Plus account. Heidi Plus users will require Gold level access in order to use these dashboards.
To access Heidi Plus and to arrange for the appropriate level of access, please contact your organisation’s Heidi Plus lead contact. You can also email customer.success@jisc.ac.uk.
Pricing
Discover diversity: HE staff intersectionality is available with an annual subscription fee between £515 - £2,318 + VAT (dependent on the number of students at your provider).
Data source
The data within discover diversity is quality assured and goes through strict validation processes. This product is based on HESA staff data.
Support
Our experienced customer success team are on hand to answer your general user queries. To get in touch, email customer.success@jisc.ac.uk.
Get started
For more information and to get started, arrange your initial consultation.
Partners
ISO certification
This service is included within the scope of our ISO9001 certificate.